


For many SME owners, the day ends with a familiar ritual. Close the cash drawer, glance at total sales, then move on to tomorrow’s stock orders and staff schedules.
Revenue is usually the first number people check. It tells you how the day went, but not necessarily why.
Behind that figure are dozens, sometimes hundreds, of transactions revealing what customers bought, when they visited, how they paid, and which products moved fastest. Together, those numbers can answer questions that shape next week’s decisions.
A POS report is more than an end-of-day summary. It is a running record of how your business behaves.
Once you know what to look for, that screen full of numbers starts becoming a practical decision tool. This guide walks through the reports that matter most and shows how they can help with staffing, inventory planning, and understanding customer habits.
Editors Pick
- What is a POS system? A complete guide for SMEs
- How Does a POS System Work? A Step-by-Step Guide
- How to Choose a POS System
- How to Read POS Report
The numbers are already there, ready to support better decisions
Every transaction creates useful information. A modern POS records sales, customer counts, payment methods, and inventory movement throughout the day. Those numbers become increasingly valuable as businesses grow.
According to IRAS, businesses with annual taxable turnover above S$1 million are required to register for GST. Accurate reporting helps support both visibility and compliance.
Singapore’s Productivity Solutions Grant (PSG) also supports digitalisation efforts. Eligible SMEs may receive support of up to 50%, capped at S$30,000, for approved solutions. Many IMDA-approved POS vendors are listed on GoBusiness Tech Depot, giving business owners more options when selecting reporting-capable systems.
What does a daily sales report actually tell you?
A daily sales report explains the activity behind the revenue.
Besides total sales, most POS daily revenue reports include transaction count, average basket size, customer count, and refunds. Looking at these metrics together creates a more complete picture.
Imagine two days generating S$4,000 in revenue.
| Metrics | Monday | Tuesday |
|---|---|---|
| Revenue | S$4,000 | S$4,000 |
| Transactions | 130 | 95 |
| Average Basket Size | S$31 | S$42 |
Although revenue remains identical, Tuesday customers spent more per transaction. This could indicate stronger product bundles or higher sales of premium items.
Revenue tells you what happened. Basket size and transaction count explain why.
How do you spot your peak hours from POS data?
Peak-hour reports reveal when demand naturally rises.
A café in the CBD may experience heavy traffic between 8am and 10am. Retail stores often welcome more shoppers after office hours, while salons usually see stronger appointment volumes on Friday evenings and weekends.
These patterns influence more than staffing. Restaurants can prepare ingredients earlier before lunch crowds arrive. Bubble tea shops can prepare toppings before evening rush periods. Retail stores can allocate more cashiers during weekend promotions.
Seasonal events also affect hourly patterns. During Chinese New Year and year-end shopping periods, traffic may extend beyond normal peaks. Historical reports help businesses anticipate these periods instead of reacting at the last minute.
Which inventory signals should you check before restocking?
Inventory reports reveal fast-moving and slow-moving products.
Popular items deserve priority during replenishment planning, while slower products may perform better through bundles or promotions.
For example, a bubble tea outlet might see the following weekly movement:
| Product | Weekly Sales |
|---|---|
| Brown Sugar Milk Tea | 220 cups |
| Matcha Latte | 100 cups |
| Mango Smoothie | 45 cups |
A clothing retailer may discover that medium-sized shirts sell faster than other sizes. A beauty salon might identify retail products that customers regularly purchase after treatments.
Labamu’s Insight dashboard is one example of a reporting tool that combines gross revenue, profit, transaction count, customer data, and payment breakdowns in one view. Business owners can compare 1, 7, 14, or 30-day periods and download reports for offline reviews, making inventory decisions easier to support.
What your payment method mix says about your customers
Payment reports reveal changing customer preferences.
Many businesses in Singapore now process transactions through cards, PayNow, SGQR, digital wallets, and cash. The balance between these payment methods can provide useful operational insight.
Suppose your POS report shows:
| Payment Method | Share |
|---|---|
| Credit Card | 45% |
| PayNow | 35% |
| SGQR | 15% |
| Cash | 5% |
A higher share of PayNow and SGQR transactions often indicates that customers prioritise convenience and speed.
These reports also support smoother reconciliation. Cash-heavy businesses need larger cash floats and more manual counting at closing. Businesses with stronger digital payment adoption often enjoy simpler end-of-day balancing.
Settlement timing is another useful consideration. Card payments may arrive according to bank processing schedules, while PayNow transactions are often reflected faster. Understanding this mix helps owners plan cash flow and supplier payments more effectively.
Businesses that sell through multiple channels can also benefit from reviewing payment reports regularly. A restaurant handling dine-in orders alongside GrabFood or Foodpanda deliveries may receive funds on different settlement schedules. Knowing how each payment source contributes to daily revenue helps owners reconcile accounts more smoothly and maintain better visibility over cash flow.
Reading your report against last week, not just today
One day’s number rarely tells the complete story.
Comparing today’s figures with the same day last week or the same week last month creates stronger benchmarks.
Seasonality is particularly important in Singapore. School holidays often increase family dining traffic and shopping activity. F&B businesses near tourist attractions or shopping malls may experience stronger lunch and dinner demand during these periods.
Retail stores frequently see higher sales before Chinese New Year and year-end celebrations. Hampers, gifts, and festive items usually move faster during these months. Beauty salons and barbershops often receive more appointments ahead of Hari Raya and wedding seasons, while tuition centres and enrichment businesses may see changing demand patterns during school breaks.
Weather can also influence sales patterns. A rainy week may reduce walk-in traffic for some retailers while increasing delivery orders for restaurants and cafés. Looking at 7-day, 14-day, and 30-day reports helps owners distinguish temporary fluctuations from recurring trends.
For example, if Friday dinner sales consistently outperform Tuesdays across four consecutive weeks, a restaurant can allocate additional manpower and ingredients on Fridays. Likewise, a retail shop that notices stronger sales near payday periods may time promotions and stock replenishment around those dates.
Over several months, these comparisons create a more complete picture of how customer behaviour changes throughout the year. That perspective makes planning for festive seasons, promotions, and inventory cycles much easier.
Turning weekly numbers into next week’s decisions
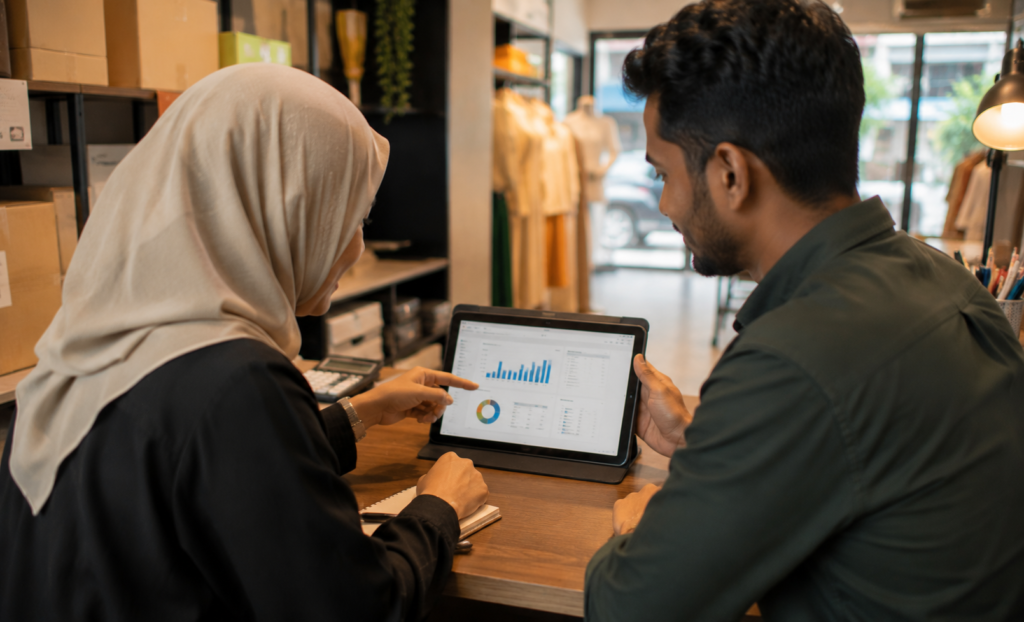
Reports become valuable when they guide action.
If a café consistently sees an 8am rush, managers can add another barista during that period. If chicken rice sells faster every Friday, ingredient orders can be adjusted accordingly.
Retail businesses may discover that electronics accessories perform better near payday periods. Promotions can then be scheduled around those weeks. Beauty salons might identify high-demand appointment slots and extend operating hours before festive seasons.
| Report Type | Insight | Action |
|---|---|---|
| Daily Sales | Higher average basket size | Expand bundles |
| Peak Hour Report | Morning traffic spike | Increase staffing |
| Inventory Report | Fast-moving items | Reorder earlier |
| Payment Method Report | Higher PayNow share | Improve reconciliation |
These decisions create smoother operations and help businesses align resources with actual customer behaviour.
Making your POS reports work harder for your business
Every transaction creates information. Over time, those numbers reveal customer habits, seasonal patterns, and opportunities for growth.
Business owners who regularly review their reports gain a clearer understanding of what drives performance. They can plan inventory with greater confidence, align staffing with demand, and time promotions around actual buying behaviour.
Modern POS platforms increasingly make these insights easier to access. Labamu is one example of a POS system that transforms daily transactions into a practical Insight dashboard designed for SME owners.
See how Labamu turns daily POS data into clear business Insight.